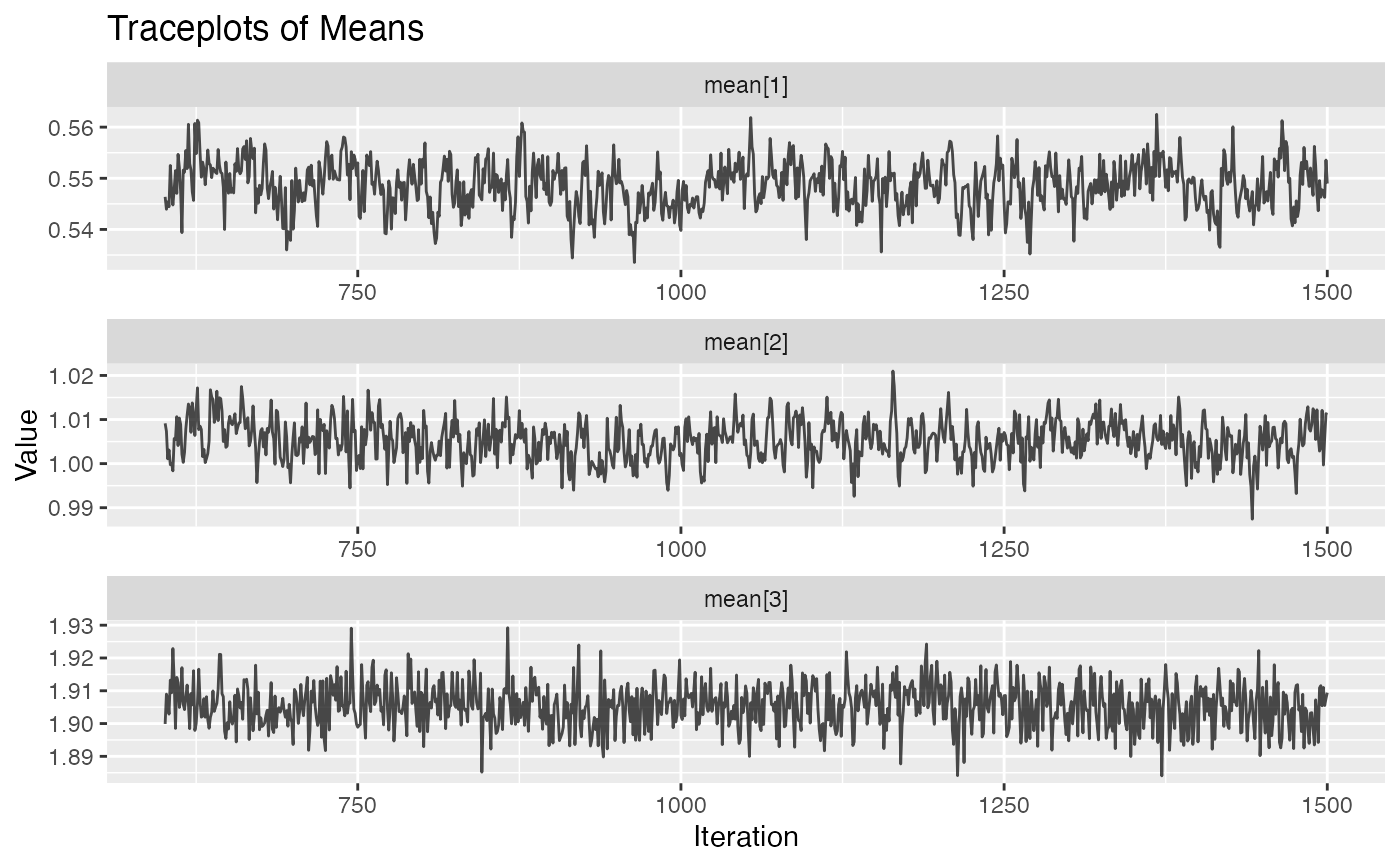
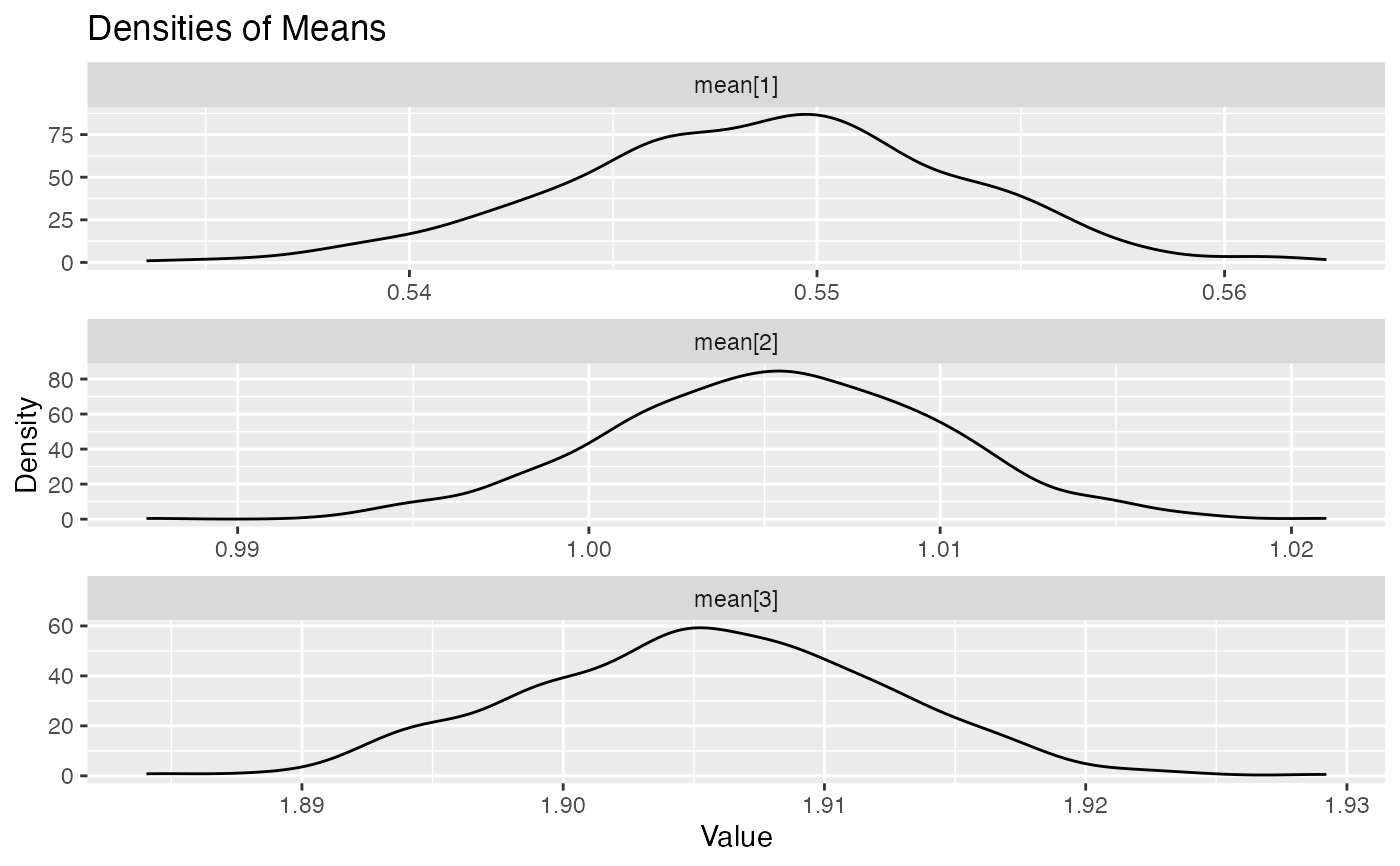
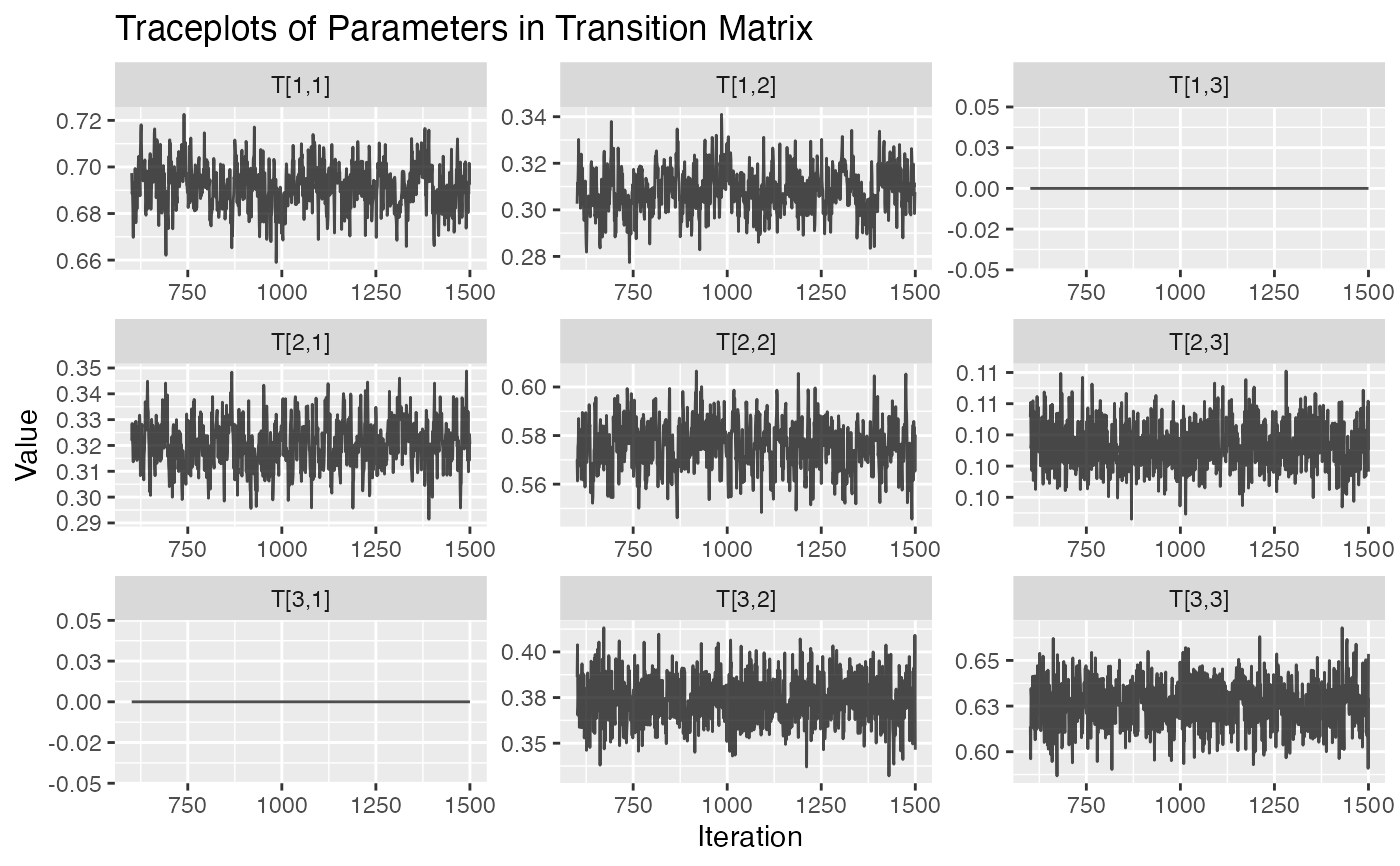
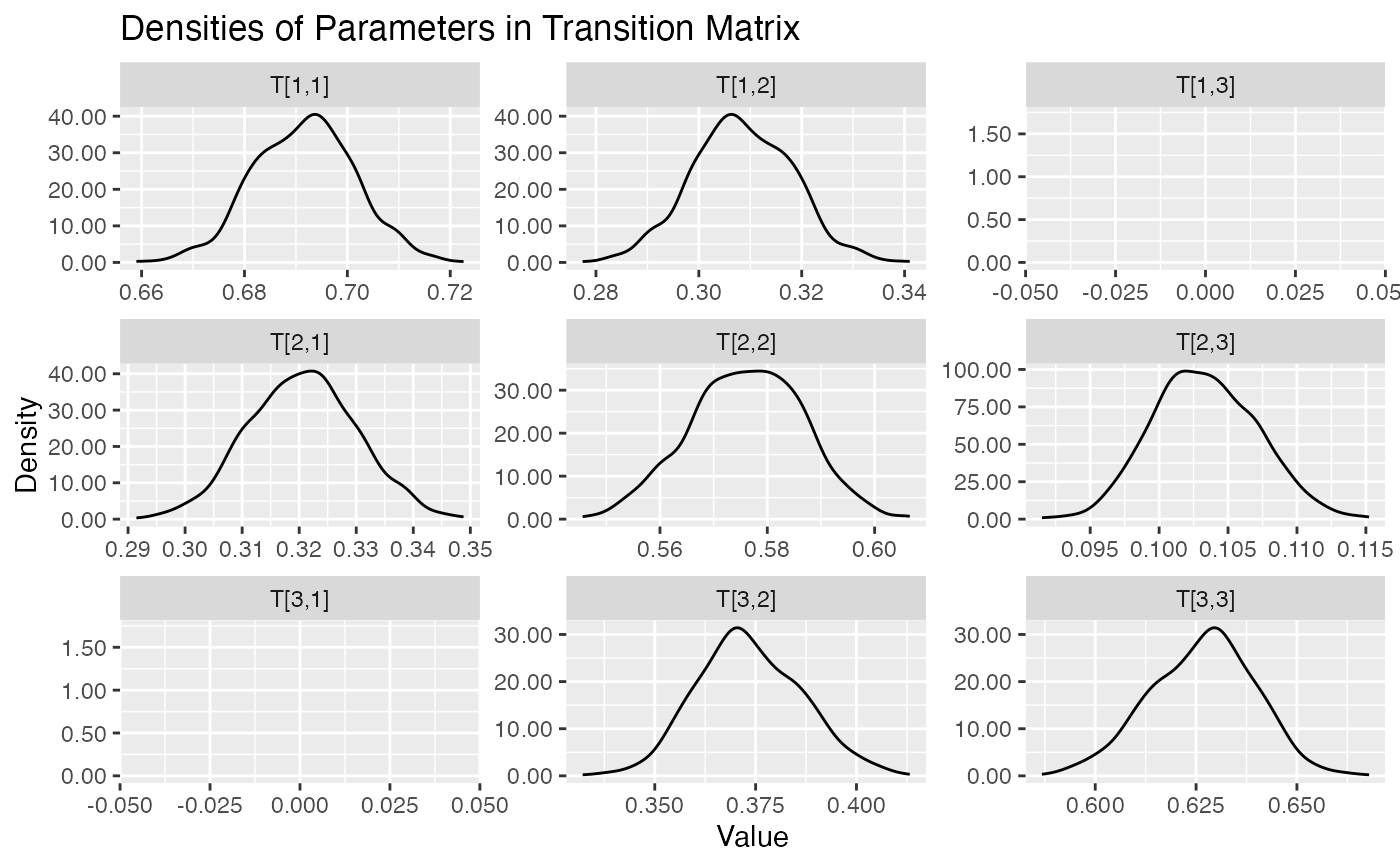
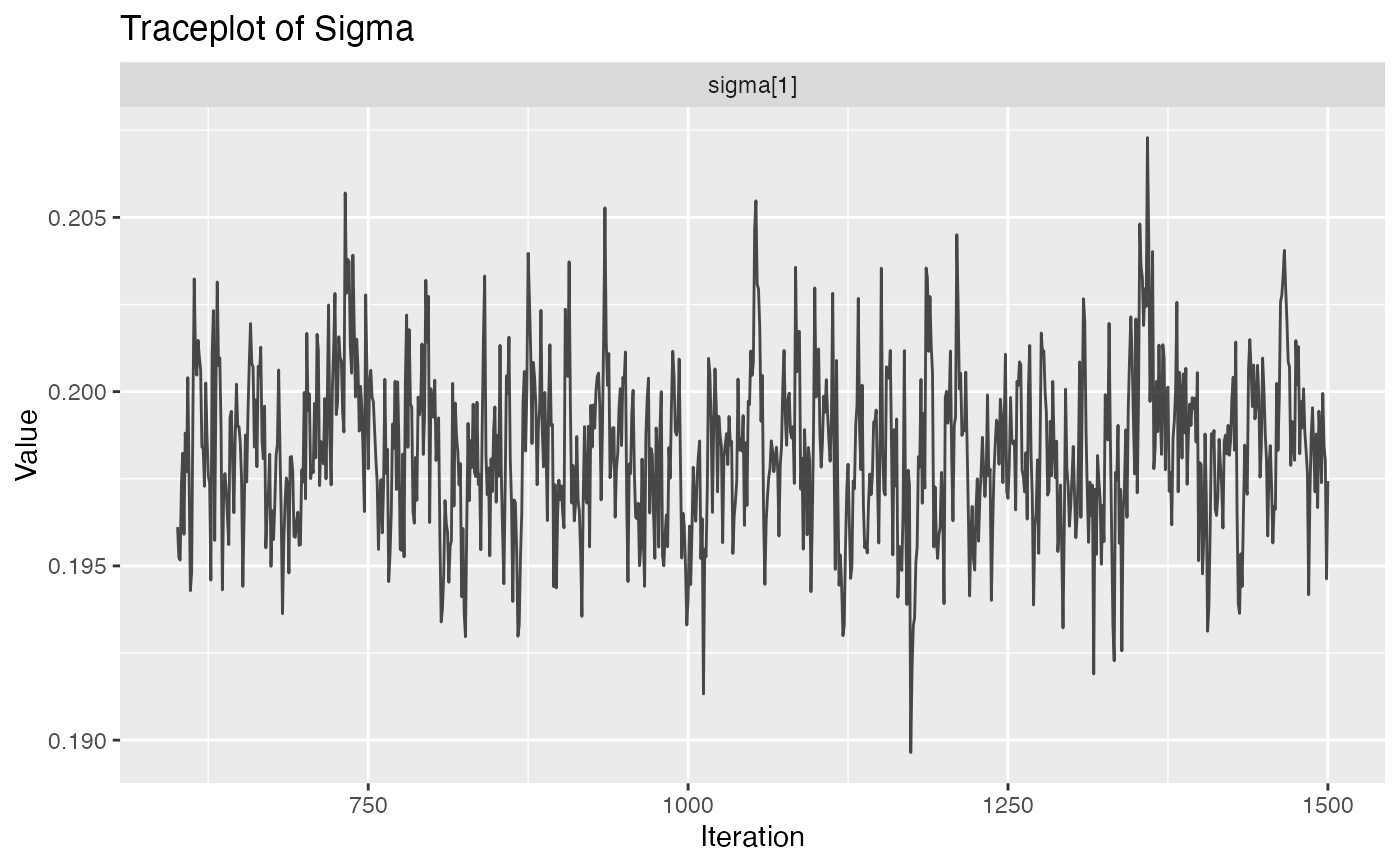
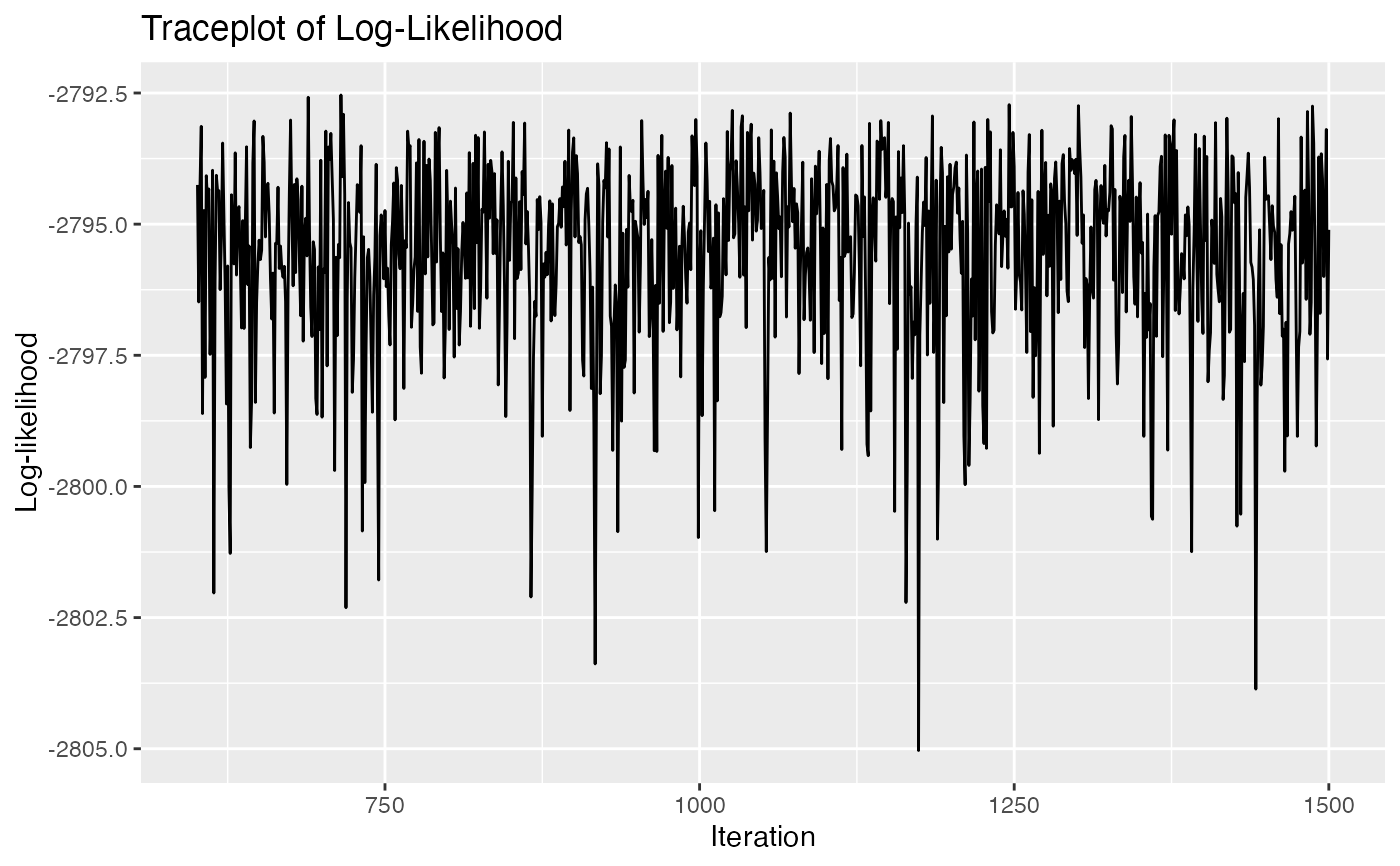
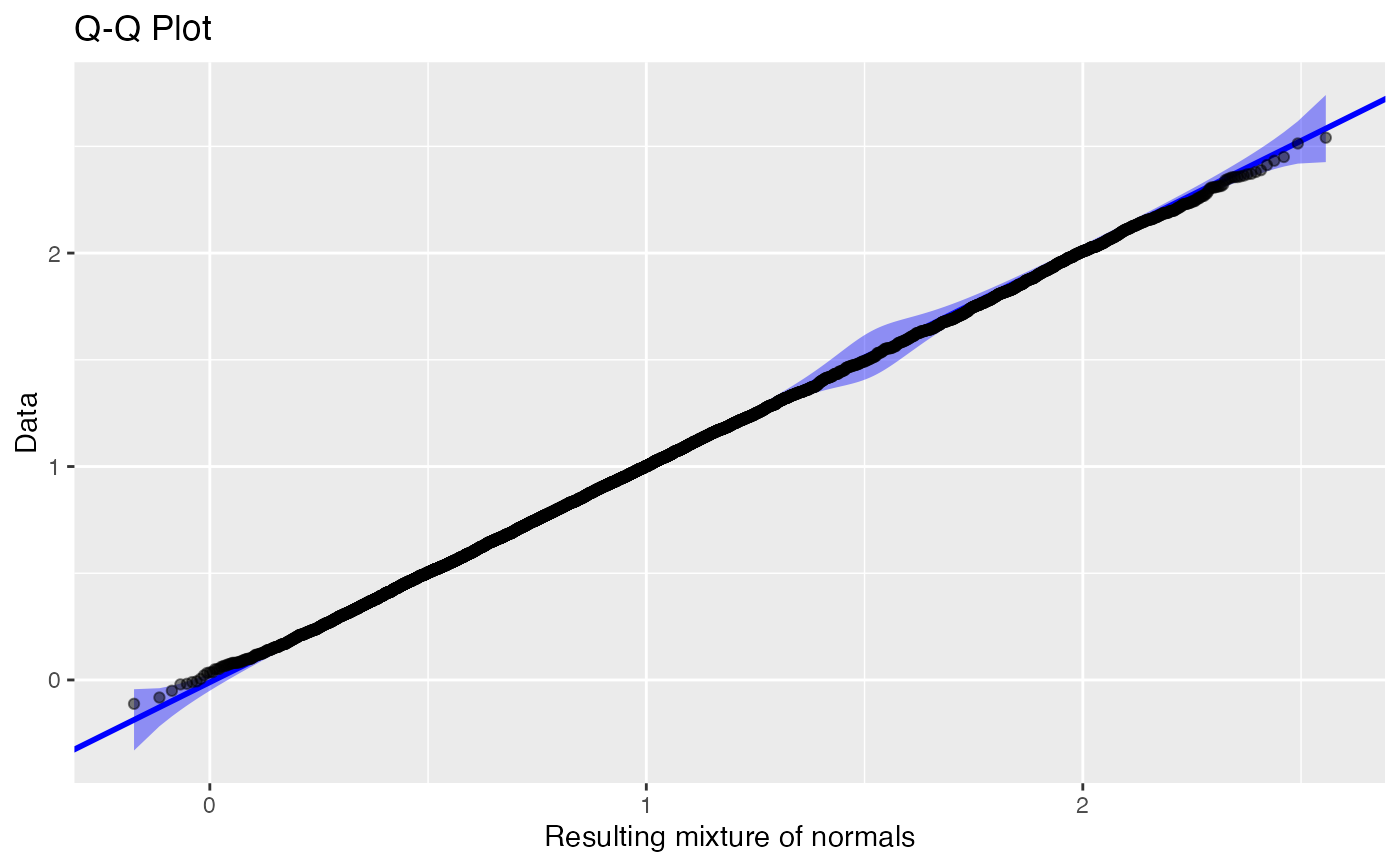
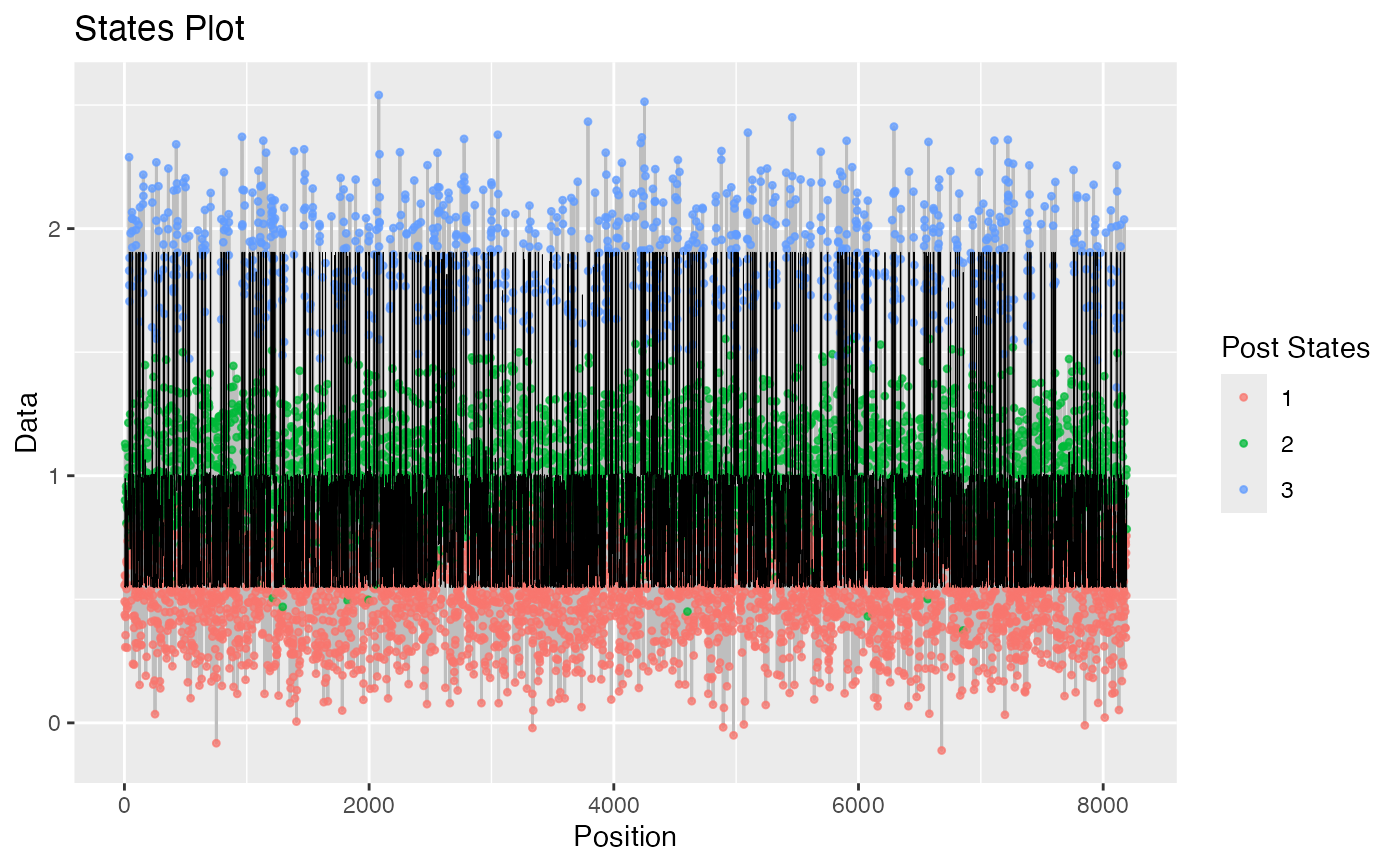
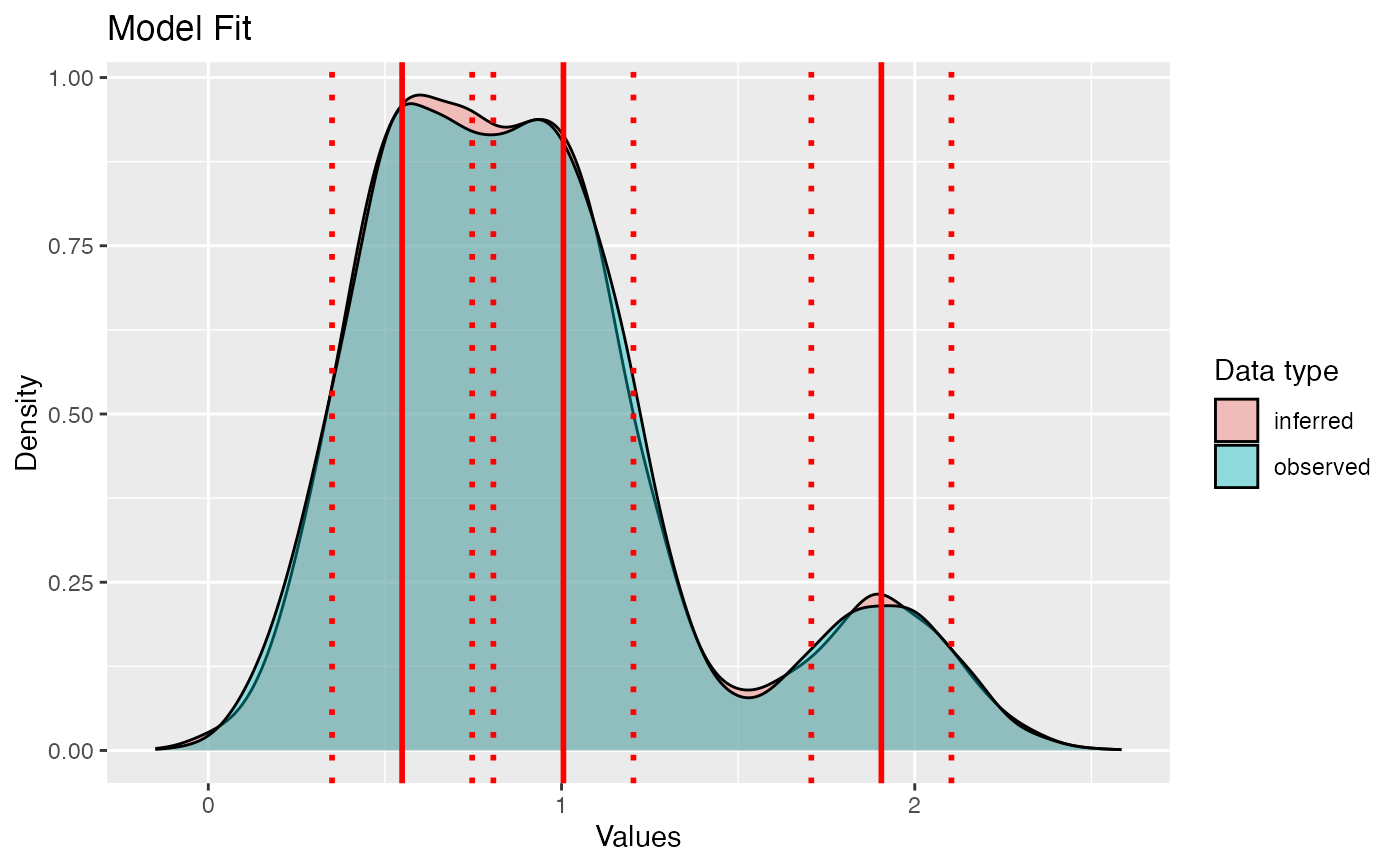
This function creates a variety of diagnostic plots that can be useful when conducting Markov Chain Monte Carlo (MCMC) simulation of a normal hidden Markov model (HMM). These plots will help to assess convergence, fit, and performance of the MCMC simulation
Usage
# S3 method for class 'hmm_mcmc_normal'
plot(
  x,
  simulation = FALSE,
  true_means = NULL,
  true_sd = NULL,
  true_mat_T = NULL,
  true_states = NULL,
  show_titles = TRUE,
  ...
)
Arguments
- x
(hmm_mcmc_normal) HMM MCMC normal object
- simulation
(logical)
optional parameter; default issimulation=FALSE, so the input data was empirical. If the input data was simulated, it must be setsimulation=TRUE.- true_means
(numeric)
optional parameter; true means. To be used ifsimulation=TRUE- true_sd
(numeric)
optional parameter; true standard deviation. To be used ifsimulation=TRUE- true_mat_T
(matrix)
optional parameter; true transition matrix. To be used ifsimulation=TRUE- true_states
(integer)
optional parameter; true states. To be used ifsimulation=TRUE- show_titles
(logical)
optional parameter; ifTRUEthen titles are shown for all graphs. By default,TRUE- ...
not used
Examples
# \donttest{
plot(example_hmm_mcmc_normal)


# }
# }